The cost of living is going up. The Bureau of Labor Statistics’ (BLS) April Consumer Price Index (CPI) rose 8.3% over the past year, higher than consensus estimates.
From food to energy, cars and shelter, no sector is safe from inflation.
But higher prices don’t always translate to less affordability, relatively speaking. The Housing Affordability Index (HAI) measures whether a typical family earns enough income to qualify for a mortgage on a typical home at the national and regional levels based on the most recent price and income data.
It’s significant in projecting demand, particularly in real estate. When homes are affordable, people are more likely to buy them. Unfortunately for buyers, homes are becoming less affordable.
According to the National Association of Realtors, the National Home Affordability Index has fallen to 124.0 today from 175.2 as of March 2021. As of March 31, 2021, the typical family could qualify for a mortgage on a home worth 175.2% more than the typical house costs. As of March 31, 2022, that number dropped to 124.0%.
For context, in 2005, near the peak of the last major housing boom, the HAI was 113.2, according to NAR.
The HAI is derived using median home values, national mortgage rates, and median family income. All else equal, if you’re making more money or paying a lower interest rate, homes become more affordable.
So, how are these metrics changing?
Median family income
Nationwide median family income has risen approximately 10.6% since 2019 from $80,100 to $89,400, approximately 3.5% annually. The level of increase in the face of the COVID-19 pandemic is significant.
Two years ago we experienced widespread economic shutdowns that threatened the employment of millions of Americans. We saw a tremendous response from industries pivoting. Ultimately, the impact to family income was not as significant as many expected.
Asset values and inflation
Supply chain disruptions and shortages drastically impacted the supply of consumer goods, ranging from lumber to computer chips. The end result was substantial inflation and home price appreciation.
Median home values have risen nearly 40% since 2019 from $274,600 to $382,000, approximately 13.0% annually.
Starting to piece the puzzle together, when asset values increase faster than income, assets become less affordable.
To make matters worse, inflation outside of home prices means families are spending more for other goods and services, too. The result is that even less take-home income is available to put toward a mortgage payment.
Click to enlarge.
Interest rates
Income is up—that’s good. Home values and other goods and services are up—that’s bad.
What’s also bad is that the Federal Reserve’s response to rising inflation is to increase interest rates, directly impacting home affordability.
Mortgage rates in 2019 were at 4.04% before falling to 2.89% in September 2021. Interest rates increased to 4.24% as of March 2022 and to 5.48% as of May 2022, driving affordability even lower.
Home values began their most precipitous increase in October 2021 when interest rates bottomed out. Rapidly increasing rates have the opposite impact.
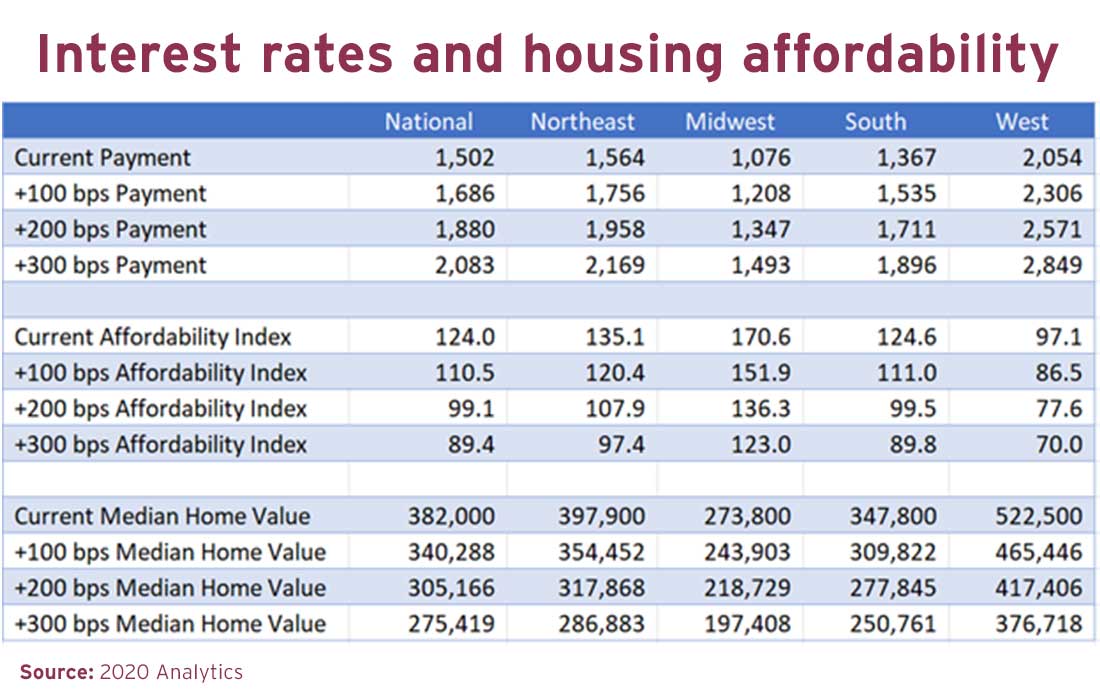
Take the example in the figure.
To summarize, a family could purchase a median-level home ($382,000) in March 2022 with a monthly payment of $1,502. However, that payment would only be enough to purchase a $275,419 home if interest rates increased by 300 basis points, a decrease of $106,581 or 27.9%.
Other considerations
Certainly, the sensitivity analysis on interest rates and the decrease in purchasing power illustrated in Figure I does not occur in a vacuum. Market forces will react once interest rates rise, and the factors of supply and demand are dynamic across different rate levels.
For instance, if rates increase as modeled above, demand for mortgages will likely go down, particularly in the refinance market, thus dragging down prices and increasing purchasing power.
On the other hand, the increased rates may also encourage people considering a move to stay put in their current fixed-rate mortgages, limiting the supply of properties and pushing prices higher.
Such market forces would somewhat offset each other, but would also affect the numbers reported in the chart if built into the model.
This example illustrates why it is important for credit unions to understand how economic fluctuations affect home values.
By understanding how interest rates and household income affect home values, and how home values affect the balance sheet, credit unions can more efficiently allocate assets and mitigate risks.
DAN PRICE is VP of professional services at Trellance, a CUNA Strategic Services alliance provider.